
Skip to content
Renew Earth News

DATA-DRIVEN INVESTIGATION & ANALYSIS | CLIMATE BUDGET FY2026-27

Mapping the visible half of Bangladesh’s climate-tagged development budget exposes a major transparency gap and signs that several high-risk districts may be receiving too little.

Md Ibrahim Khalilullah · 11th August 2026

Tk0cr

total climate-related budget

Tk0cr

climate-relevant development allocation

0

project rows found in Annex 2

0.0%

gross project value locatable

CORE FINDING

A large climate budget, but no usable map of fairness

Bangladesh has identified Tk51,746 crore for climate-related activities in FY2026–27. But the budget presents no usable locality-level assessment showing whether the most exposed communities receive a fair share.

Renew Earth News examined 521 climate-tagged development-project entries, located projects whose official descriptions contained sufficient geographic information and compared the visible allocations with climate vulnerability, poverty, population and recorded disaster losses.

The investigation begins with field reporting from Barishal, Nilphamari, Netrakona and Dhaka, and then follows the money across Bangladesh.

Bangladesh has budgeted Tk51,746.16 crore for climate-related activities in FY2026-27, including Tk37,132.43 crore of climate-relevant development spending. Yet the public climate-finance report organises projects by ministry and title, not by district, vulnerable population or expected outcome.

This analysis reconstructed the geography of every machine-readable project row in Annex 2. The report's narrative says there are 522 development projects; the annex yields 521 project-code rows. Those rows carry a gross annual budget of Tk87,868.62 crore. Because individual climate-relevance coefficients were not disclosed, district rankings use gross budgets, while per-resident amounts use a scaled proxy to reconcile with the Tk37,132.43 crore figure.

What the visible slice says

Click each question to open the evidence-based answer from the analysis.

  • Evidence-based answer

    Dhaka by total visible money; Dhaka and the three Chattogram Hill Tracts districts by money relative to population-and-CVI need.

The fairness test

A district's share of locatable gross project budgets divided by its district's share of national need, where need = population × LoGIC Climate Vulnerability Index. A score of 1 is proportional; below 1 = smaller visible share; above 1 = larger visible share. This is a diagnostic, not an entitlement formula.

Why "visible" matters

A district can look underfunded because a national programme reaches it without naming it. It can also look well funded because a large construction site is located there even when benefits extend nationally. Rankings identify questions for verification, not final judgments on performance.

Part 01

The first fairness gap is missing geography

Of the 521 climate-tagged project rows, 255, worth Tk43,346.47 crore in gross FY2026-27 budgets, name at least one district in their title. The remaining 266 rows, worth Tk44,522.15 crore, are national, regional, or have no usable location. Of the locatable set, 203 are single-district and 52 are multi-district.

1. Half of tagged money lacks a district

FY2026-27 gross annual budgets of climate-tagged development projects. Click a segment to inspect.

49.3%of gross project budgets can be assigned to one or more districts

Preparing chart…

521

rows in annex

522

projects in narrative

Tk87,868.62cr

gross budgets

Tk37,132.43cr

climate-relevant

Source: Finance Division climate budget report, Annex 2. Analysis uses title-based locations; multi-district budgets split equally. Gross annual budgets of climate-tagged development projects; not project-level climate-weighted amounts.

This invisibility is not evenly distributed. Large national agriculture, forestry, energy, social-protection and institutional programmes may serve vulnerable districts, but the annex does not say where. The fairness analysis can therefore assess only the visible half of the portfolio.

Part 02

Start where the budget map goes blank

Scroll to land on Nilphamari's empty annex geography, then move through other high-risk districts that sit far below their population-and-risk share.

2. Blank map, then the underfunded districts

Fairness index = district share of locatable money ÷ (share of CVI × population need). Scroll the tour - Nilphamari opens blank, then the map zooms district by district. A score below 1 indicates a smaller share of visible money than the population × CVI benchmark.

Loading Bangladesh district map…

Scroll to continue →

  1. Nilphamari. Nilphamari is high-risk on the LoGIC CVI, yet no FY2026–27 project budget can be located from annex titles. The published map goes blank here - that absence is the finding. Fairness 0.00, CVI 0.52, poverty 22.2%, visible budget Tk0cr.
  2. Bogura. Bogura's fairness index is 0.02: less than 5% of its population-and-risk share. Fairness 0.02, CVI 0.49, poverty 12.0%, visible budget Tk20cr.
  3. Rangpur. Rangpur's fairness index is 0.04: less than 5% of its population-and-risk share. Fairness 0.04, CVI 0.51, poverty 21.8%, visible budget Tk37cr.
  4. Sirajganj. Sirajganj's fairness index is 0.04: less than 5% of its population-and-risk share. Fairness 0.04, CVI 0.49, poverty 10.9%, visible budget Tk40cr.
  5. Naogaon. Fairness index 0.13 · CVI 0.50 · poverty 16.2%. Fairness 0.13, CVI 0.50, poverty 16.2%, visible budget Tk100cr.
  6. Tangail. Fairness index 0.15 · CVI 0.50 · poverty 13.3%. Fairness 0.15, CVI 0.50, poverty 13.3%, visible budget Tk162cr.
  7. Dinajpur. Fairness index 0.17 · CVI 0.51 · poverty 25.7%. Fairness 0.17, CVI 0.51, poverty 25.7%, visible budget Tk154cr.
  8. Gaibandha. Fairness index 0.20 · CVI 0.52 · poverty 24.6%. Fairness 0.20, CVI 0.52, poverty 24.6%, visible budget Tk148cr.
  9. Panchagarh. Fairness index 0.23 · CVI 0.49 · poverty 33.2%. Fairness 0.23, CVI 0.49, poverty 33.2%, visible budget Tk72cr.
  10. Sherpur. Fairness index 0.23 · CVI 0.50 · poverty 19.9%. Fairness 0.23, CVI 0.50, poverty 19.9%, visible budget Tk95cr.
  11. Thakurgaon. Fairness index 0.27 · CVI 0.50 · poverty 23.3%. Fairness 0.27, CVI 0.50, poverty 23.3%, visible budget Tk91cr.
  12. Netrakona. Fairness index 0.30 · CVI 0.52 · poverty 33.9%. Fairness 0.30, CVI 0.52, poverty 33.9%, visible budget Tk164cr.
  13. Patuakhali. Patuakhali, the highest-CVI district in the LoGIC index, has a fairness score of 0.68, still below the benchmark. Fairness 0.68, CVI 0.56, poverty 18.0%, visible budget Tk289cr.
  14. Haor belt. The haor districts Netrakona, Sunamganj and Kishoreganj score 0.30, 0.36 and 0.37 respectively. Netrakona's poverty rate is 33.9% and Kishoreganj's is 35.3%, which strengthens concern over low visible climate funding.

Sources: Finance Division FY2026-27; LoGIC CVI; BBS Census 2022; Poverty Map 2022. National and region-only budgets are excluded.

Explore the full ranking

Filter near-zero or haor districts, sort by poverty or CVI, and click a bar for the gap to proportional funding.

All listed selected. 15 districts displayed.

Preparing chart…

Click a bar or name. Bars run toward the proportional line at 1.0 - every district here falls short. Showing 15 districts.

A score below 1 indicates a smaller share of visible money than the population × CVI benchmark.

Sources: Finance Division FY2026-27; LoGIC CVI; BBS Census 2022; Poverty Map 2022. National and region-only budgets are excluded.

Patuakhali, the highest-CVI district in the LoGIC index, has a fairness score of 0.68, still below the benchmark. The haor districts Netrakona, Sunamganj and Kishoreganj score 0.30, 0.36 and 0.37 respectively. Netrakona's poverty rate is 33.9% and Kishoreganj's is 35.3%, which strengthens concern over low visible climate funding.
Meher Nigar on the open veranda of her home beside the Meghna
Meher Nigar · Hijla, Barishal · Meghna riverbankPhoto: Md Ibrahim Khalilullah

FIELD REPORT

From a Meghna riverbank to a blank budget map: what four places reveal about climate money

The fairness map has already shown three sharply different pictures. In Nilphamari, the published project titles reveal virtually nothing that can be assigned to the district. In Netrakona, identifiable funding falls far below its population-and-vulnerability benchmark. In Dhaka, major infrastructure projects create the country’s largest visible concentration of climate-tagged development money.

Those figures do not establish what communities ultimately receive. Reporting from the three districts - and from Barishal’s Meghna riverbank - shows what that visibility, or invisibility, means on the ground.

On the ground

Follow the story district by district

Click a place to open its report. The map frames that district; the story fills the page beside it. Move on when you are ready for the next location.

Loading Bangladesh district map…

Chapter 01 of 04

Barishal · Meghna riverbank

Subject
Meher Nigar, 65
Place
Hijla, Barishal
River
Meghna

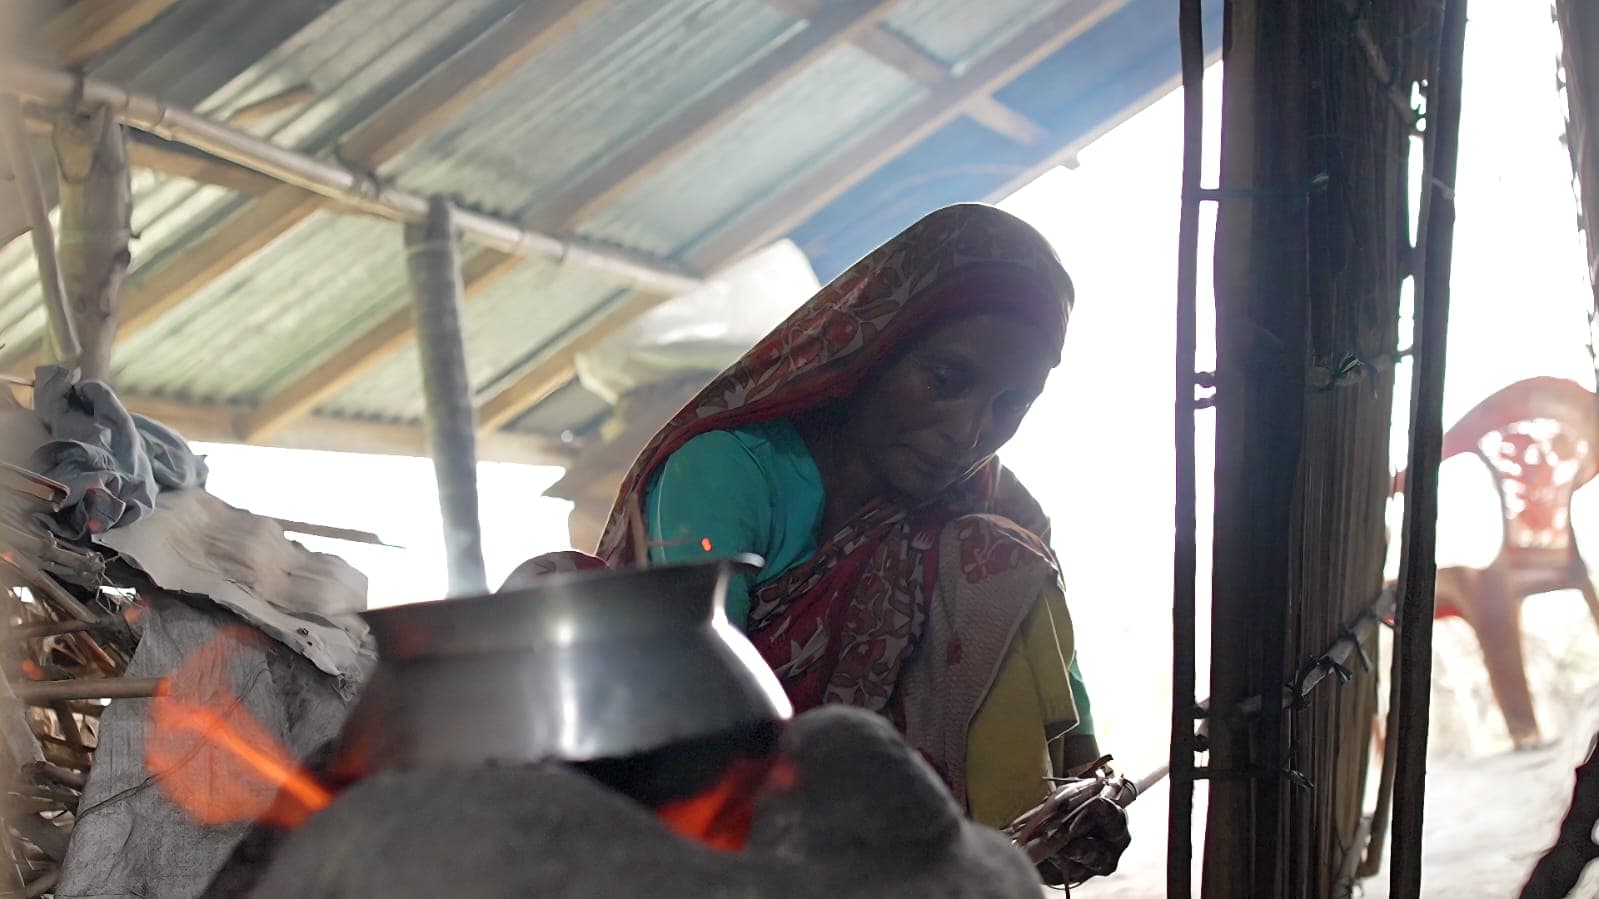
Meher Nigar roasts dried chilies on the open veranda of her home beside the Meghna. This half of the veranda is the family’s kitchen. Lunch will be rice, lentils and chili paste.

Meher Nigar is 65 years old and lives in Hijla Upazila of Barishal district, in southeastern Bangladesh.

People think about food, about treatment, about education. We think first about saving our lives.

- Meher Nigar

Extreme poverty has never lifted from Meher’s family. “We have never had rice, fish, vegetables, and pulses on the same plate,” she said. “We live by the river so we sometimes catch fish. The thing we lack most is rice.”

“Whatever we earn goes to rice,” Meher said. “What is left for medicine, for school, for the house?”

Behind her stands a single room shared by seven people: Meher, her husband Dulu Aladar, two sons, a daughter-in-law and two grandchildren. A sheet divides their sleeping spaces. The walls are made of rice straw and the roof of old corrugated iron.

There is no grid electricity along this part of the riverbank. At the time of the reporting visit, the family’s small solar panel was broken.

Two blue plastic drums hold some of their clothes and cooking utensils. They are more than containers. If the riverbank collapses, the drums should float, giving the family a chance to recover at least a few possessions.

The Meghna was then about 15 feet from Meher’s home.

Her husband pointed approximately 200 meters into the river. Their former homestead, with its courtyard, cowshed, farmland and family burial ground, had stood there four years earlier, he said. Cargo vessels now travel across the water where the family once lived.

The household has already been displaced and rebuilt four times. If the river takes this home, there may be no land left nearby on which to rebuild again.

That uncertainty shapes every part of Meher’s day: cooking in a temporary-looking kitchen, keeping possessions ready to move, and trying to feed seven people after the river consumed the family’s farmland.

Meher does not know where she will go if the river takes the house again. Even at her age, life carries no promise. She lives every day in the fear of losing her roof. “People think about food, about treatment, about education. We think first about saving our lives,” she said. “Every night I think about whether I will be alive in the morning. Whether the house will be.” She drew a long breath.

“We have not a single penny saved. We do not know if there will be a meal tomorrow. We have no money for medicine, no money for school. To think about those things is a luxury for us. We only think that the river will not take our lives, that the river will not drown our land.”

The family said it had received no housing, food, medical or land assistance from the government, and no support from an NGO.

That experience cannot, on its own, establish whether a particular climate project should have assisted Meher’s household. But it gives human meaning to a question that Bangladesh’s national budget does not answer.

Next: Nilphamari

What the ground reports add

Barishal gives the blank and overloaded map a human scale: displacement without a visible safety net. Nilphamari shows a high-risk district vanishing from published project geography. Netrakona shows identifiable funding far below a population-and-risk benchmark where hazards and poverty meet. Dhaka shows how trunk infrastructure can dominate the visible budget while neighbourhood protection remains an open question.

Officials have acknowledged weaknesses in planning and tagging. Those statements name the policy problem; they still do not supply district allocations, project-level climate coefficients, which national programmes reach these places, or resolve the report’s 522 projects versus 521 annex rows.

That missing layer is the investigation’s centre. Bangladesh can count climate-tagged projects. The public still cannot fully see where much of the money is meant to go, who should benefit, or whether investment follows the geography of risk.

WHAT THE FINDINGS DEMAND

Three asks before the system reply

Compact policy stakes drawn from the analysis - then the accountability chapter and official responses.

unmapped spend

Geographic fairness cannot be credibly assessed when more than half of climate-tagged spending has no district-level destination. The government should require project-level geographic tagging, including multi-district and community as well as national-benefit classifications.

of the formula

Both climate and nature vulnerability should be major allocation criteria, ideally 40-50% of the formula, alongside population, poverty, disaster losses, readiness and wider economic benefits. Vulnerability should guide priority, while readiness should determine sequencing, not exclusion.

correlation

A correlation of 0.26 indicates that climate vulnerability has only a weak influence on visible funding. Current allocations appear to be driven more by infrastructure pipelines, institutional capacity, political priorities and project readiness than by climate risk.

Zakir Hossain Khan

Co-founder and Managing Director, Change Initiative and Policy Specialist.

GOVERNMENT RESPONSE

They named the gaps. They did not close the map.

Government responses support the investigation’s call for stronger data and clearer classification, while leaving key district-level questions unresolved.

Senior officials have acknowledged weaknesses in how Bangladesh folds climate risk into development planning and classifies climate expenditure - the same gaps that leave Nilphamari hard to find on the annex map, Netrakona under its risk share, and Dhaka dominating visible totals.

Hear the officials and the experts. Then notice what still does not appear: district allocations that would settle the field findings.

Still open after the field reports

Nilphamari
Blank on the annex map
Fairness 0.00
Netrakona
Below the risk share
Fairness 0.30
Dhaka
Visible money concentrates
Fairness 5.53

The voices

What officials and experts told us

Move through each voice. Read the claim, then the fuller response beneath it.

In their words01 / 03

Climate-change considerations had not yet been fully mainstreamed into development planning, resulting in fragmented initiatives.

AKM Sohel

Additional secretary and chief of the UN Wing, Economic Relations Division

Sohel said climate-change considerations had not yet been fully mainstreamed into development planning, resulting in fragmented initiatives. He called for stronger data generation and said climate research should extend beyond coastal areas to other vulnerable regions - directly relevant where northern high-risk districts barely appear on the published annex map.

Next: Dr Shah Abdul Saadi

What remains unresolved

From the Meghna riverbank to Nilphamari’s blank map, Netrakona’s under-share and Dhaka’s concentration, that omission remains central. Without district-level disclosure, the public cannot independently determine whether the areas facing the greatest climate risks receive proportionate support. Officials acknowledged planning and tagging weaknesses, but responses did not supply district-level delivery figures that would close the annex transparency gap mapped in this investigation.

EXPLORE FURTHER

Explore the numbers

The main story stops at the blank map, the field tour and the official replies. Open a panel below for the deeper charts, group patterns and related TIB accountability findings - kept here so a first reading stays focused.

METHODS AND CAVEATS

How this analysis was built

A short audit trail for first reading. Open the full pipeline if you need every construction step. Reproduce the numbers from the open-data package.

Climate-relevance factor

0.422590339

Uniform scaler from gross locatable budgets to an illustrative climate-relevant proxy.

National mean CVI

0.47716

Population-weighted mean used to normalise district CVI into vulnerable-resident equivalents.

  1. 01Project universe. Every 9-digit project-code row extractable from Annex 2: 521 rows. The narrative total is 522.
  2. 02Geocoding. Exact district names, known landmarks and an upazila-to-district concordance were matched against project titles. 203 single-district and 52 multi-district rows were located. District confidence is exact or provisional until project-level method tags ship with the companion package. Numerical displays use two decimal places for CVI and fairness (Patuakhali CVI = 0.56).
  3. 03Multi-district split. Budgets were divided equally among named districts because work-package values were unavailable. This is especially consequential for regional portfolios such as the Hill Tracts.
  4. 04Money measure. District rankings use gross FY2026-27 annual project budgets. A uniform factor of 0.422590339 scales gross locatable amounts to an illustrative climate-relevant proxy; it preserves rankings but is not a substitute for project weights.
  5. 05Vulnerable resident. Population × district CVI, normalised by the population-weighted national mean CVI (0.47716). This produces "vulnerable resident equivalents," not a headcount of individually vulnerable people.

Prefer: no locatable project budget; visible allocation; appears underfunded; requires verification. Avoid: saying a district "received nothing"; that a construction budget equals benefit.